
May 2020
Weird dreams and How my approach to biomechanics service provision has changed
I had a dream a little while ago. It was present day and I had returned to work at the South Australian Sports Institute (I last worked there in 2008). I was presenting to the coaches how I was going to approach service delivery. A curious part of the dream was that all the coaches I had been working with back in 2008 had also been re-hired by SASI - I'll explain why this is important later.
What I was talking about was how my approach had changed over the 10 years I had been away from SASI. I was proposing concentrating on the variability in an athlete's technique. This is different from my approach in 2008. Back then I would still report the variability but I would concentrate on the average technique in different contexts (such as sections of a race) to describe the athlete's performance. My processes were centred on rapid provision of information and making sure the description of the technique was placed in the right context.
What I've realised is that variability of the technical execution of a task means the athlete may have actually been executing the skill with the technique I was advocating they should transition towards. So in fact the questions should not have been;
- What is their technique?
but;
- What is their technique when they achieve their best outcomes?
- How often can they execute the skill with that technique?
- What is stopping them executing the skill with that technique more often?
- How is their ability to execute the skill with their best technique changing over time (and is that evidence of learning or are other factors such as fatigue and training phase responsible)?
- Is their best technique and outcome good enough?
If you're interested in some of the technical aspects of how I would do this then you can wade through one of my prevoius posts
So, in the dream, I finished presenting this to the coaches and one of them (Fooz if you're familiar with that group back in 2008) stuck his hand up and asked if I had based this on a service being provided elsewhere or had I come up with it myself - was there any evidence that this was the best approach?
Now, this was quite an astute question for Fooz (just kidding, he has a knack of asking good questions). In the dream I couldn't answer that. When I woke up I couldn't answer it either - I knew there was a sound basis for this approach but I couldn't say whether it had been published anywhere or whether it was just the evolution of my own thinking.
I collected some of the evidence together and submitted it to the 2020 ESSA conference which was postponed. I'll present it next year instead (and please get in touch if you want to talk about it in the meantime). But I feel if I were just coming into an institute role now that it would be difficult to reconcile a poster at a conference here or a podium there into your own philosophy of how a service should be delivered. This is particularly true for biomechanics where there are often only one or two service providers in each institute which makes it difficult for newcomers to lean on experienced practitioners to help develop their thinking. Granted, there are some professional development opportunities for institute staff, but the invite list to those is often limited.
Other sport science disciplines have a range of podcasts etc. to develop their philosophies, but it's harder to find resources like these that concentrate on service delivery in biomechanics.
This approach is not new - Ralph Mann has been using it for years in sprinting https://t.co/QnAdtJTRkK - and is at odds with what is now known in the motor control and skill acq literatures. We provided coverage here https://t.co/KednCzoN3n
— Paul Glazier (@PaulGlazier) May 17, 2020
Or maybe I'll just stick to my dreams.
Previous Posts
Designing Feedback Tools Combining Video With AMS Data
Individualised Ideal Technique from Principal Component Analysis
Don't look for analytics to give you an answer, let it help you ask better questions to overcome bias
In sports analytics, numbers don't lie - but they rarely tell the truth without some prodding
The experience and pay problem in sport science - getting angry at the symptoms or treating the problem with our value proposition?
My Journey with GPS Athlete Tracking
Getting better outcomes and saving time - does Quality Assurance have a place in Pro Sporting Organisations?
Never mind the bollocks - The fascinating case of using statistics to analyse Tiger Woods
Biomechanics and Performance Analysis, what capture and analysis will look like in 2024 but the best will be doing now
Why should you use a biomechanist?
Coaching Athletic Technique in the age of big data
Does a competitive advantage in elite sport come only from something new?
Jocks vs Nerds; Australian Summer edition...
The value of investing in knowledge; Identifying streakers and slumpers in Major League Baseball
Can sport science still provide a competitive advantage at the Olympics?
Two sides of different coins, avoiding a culture of rest in elite sport
RFID Player tracking in the NFL, predictions for the life cycle of a new technology
Feedback systems failing in the NFL? No surprises here!
Paul DePodesta and the NFL, the revolution that is aready here
Process versus outcome, the need for a voice that crosses over between coaching and support services
Harnessing technology in elite sport
Really? 100 wins in a MLB season isn't an advantage in winning a world series? Why not?
Is Sport Science the new Moneyball?
Analytics in Elite Sport
Augmented Video Feedback
Teaching Elite Skills
Scheduled Rest & Batting Averages in MLB
Combining Trackman and 3D Motion in Golf
February 2020
Designing Feedback Tools Combining Video With AMS Data
I listened to a podcast featuring Dave Anderson and Steve Gera from the Gains Group recently which touched on the future trends in AMS integration into sport. Dave talked about introducing more flexibility into the system allowing information to be communicated in the format that coaches and athletes have traditionally consumed it, not just in bar charts or line charts but in video. This is something that is really interesting to me as it requires thoughtful design and a thorough understanding of the data (how it is collected, its strengths and its limitations), how users (coaches and athletes) consume information, and human movement theory.
The underlying tension between video and data is that one is qualitative and the other quantitative. One can take a high altitude snapshot of all the information in one figure, the other requires zooming into a single instance but provides valuable context around that single instance.
The theory element revolves around variability. Variability in technical performance, tactical performance and an athlete's physical condition is a fundamental feature of elite sport. It is crucial to identify the normal ranges in performance, not only to make good judgements on what is normal and what is a real change, but also to correctly identify outliers. Those outliers are often information rich, but extrapolating from those instances to assume that happens all the time is dangerous.
Of course, if you watch enough video then you can get a feel for what is normal variability in performance, but that requires a lot of time and effort and still leaves the user open to a lot of biases such as confirmation bias, serial-position effect and clustering illusion.
Designing feedback tools that find a compromise between video and data is a difficult business. It needs to be done with the user and primary consumer front and centre, but it also needs to be done in a way that the user can't just default to their preferred method of consumption. It requires a sympathetic approach where the information that is new to the consumer (the quantitative data) is presented to compliment the understanding drawn from the old format (the video).
I've made the mistake in the past of cramming in as much information as possible to compliment video in a feedback tool. This doesn't work. The coaches didn't connect with the information. To design a successful feedback tool combining video and data currently collated in AMS you need to have clear and well defined outcomes so that only the data that truly compliments the video is presented.
Simply stating that coaches and athletes need to get better at viewing and understanding quantitative information and data is just lazy. It is likely to take continually evolving customised feedback tools designed to suit the experience and comprehension of the primary users, but this sympathetic approach is worth the effort. Combining the broader perspective provided by the quantitative data, particularly with respect to the inherent variability in elite performance, with their preferred method of consuming information can produce a powerful feedback tool.
February 2019
Individualised Ideal Technique from Principal Component Analysis
I've been playing around with a different sort of analysis (for me at least) that I'd like to share and get some opinions on.
This recent paper by Paul Glazier should provide some background to the problem I'm trying to overcome.
?? Challenging Conventional Paradigms in Applied Sports Biomechanics Research https://t.co/BAyBurDeek pic.twitter.com/FPufWY9itB
— Paul Glazier (@PaulGlazier) December 3, 2018
A key sentence from the abstract is;
"In empirical studies, group-based analyses often mask variability between athletes and only permit probabilistic 'in general' or 'on average' statements that may not be applicable to specific athletes."
It is very clear (to me at least, and to be fair I don't know of any applied biomechanist that feels differently) that an ideal technique for an individual athlete should not be based on what an 'average' elite technique looks like. But if this is the case, how do you practically identify (through data) the ideal technique that an athlete should be striving for? Or, in other words thanks to Josh Goreham…
Great article Paul. Just curious what you think an applied sport biomechanist should focus on when analyzing a single athlete’s performance? I agree with your statements in the article, but it seems as though options are dwindling for some types of “in-field” analysis. https://t.co/r7rdplG9Kg
— Josh Goreham (@goreham87) December 11, 2018
There is a problem with this approach as when you look at discrete kinematic measures you effectively discard a lot of information that is contained in the data. What I have wanted to do is to identify an athlete's 'best' performance in terms of the continuous kinetic and kinematic data. I was hopeful that this information can then be used to determine what changes between the best, the average and the poor performances within and between sessions.
To do this I've leaned heavily on the work of John Warmenhoven, and if you've got this far then I'd urge you to have a good look at his work. This tweet is probably the best place to start.
PhD defeated! For anyone interested in rowing or analyzing curves/waveforms:
— John Warmenhoven (@johnwarmenhoven) March 29, 2018
1) https://t.co/QfA81SSoNc
2) https://t.co/kua0HugPC3
3) https://t.co/2pXIPdj2A2
4) https://t.co/237SF5ONfA
5) https://t.co/U4gLF3LCpO
Extra) https://t.co/6Fq4pnf0bf
PM me if interested in any of them ?? pic.twitter.com/RbFXdz0Ryg
What this leaves you with is a score for each stroke in the first and second principal component, and it's from these data that I wanted to identify a number of strokes with similar shapes. In my mind, this lent itself to identifying clusters of similar strokes. The problem with this approach is that the data is essentially on a continuum and not at all clustered, so from a statistical perspective a cluster analysis is not appropriate. However, all I was really wanting to do is partition the data into a number of similar strokes, so what I did was to use a fuzzy cluster routine to group the similar strokes together. This has the added advantage of providing some information on how close to the centre of each cluster each stroke is, so if you wanted to you could limit your analysis to strokes with at least 80% membership of a particular group (or 90%, or 95%, whatever).
I used 6 clusters, so effectively generated 6 different types of curves that the athlete executed during the session. There was no statistical reason to choosing 6, just that I wanted to identify at least 3 to show high, medium and low power, and 6 would likely provide some flexibility without adding too much complexity. Linking this back to the power outputs from each individual stroke the clusters can be grouped into high, medium and low power shapes. Now we have an idea of what the 'best' performance looks like, and we can see where the technique changes for lower power strokes. We can also count how many high power, medium power and low power strokes there are in a piece to give an idea on physiological condition and pacing strategy.
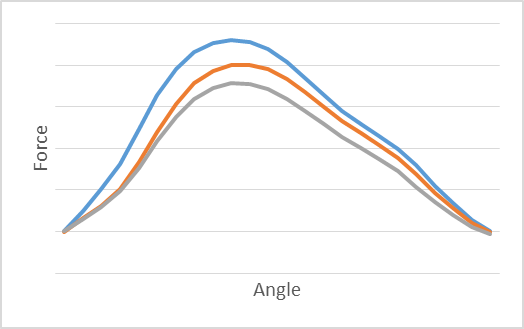
There are a number of possibilities opened up when analysing the data in this way. For instance, you can make an assessment on whether the best technique is good enough, or whether it needs some improvement. You can also look at the differences between high power and medium power shapes to give the coach and other member of the service team (like S&C coach) insight into where the athlete is breaking down in their technique. Here's an example of the shape of 3 different clusters;
But perhaps the best element of this analysis is the ability to project the PCA from a baseline test onto future tests via the predict function in r. In essence, this is using the baseline session as the training data set for the PCA and subsequent tests as the test PCA data set. You can then make direct comparisons between the number of strokes with a high power shape in the baseline and the number of strokes with a high power shape in the subsequent tests.
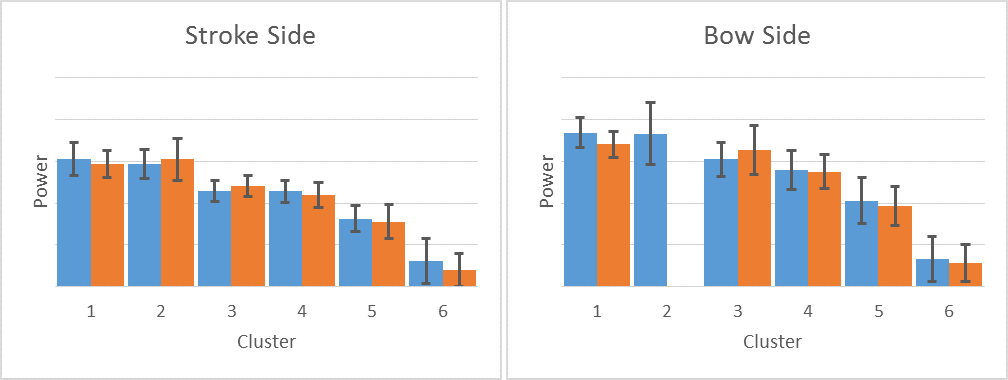
Here's a quick comparison of baseline to follow up test for power;
And for the shape of the high power curves;
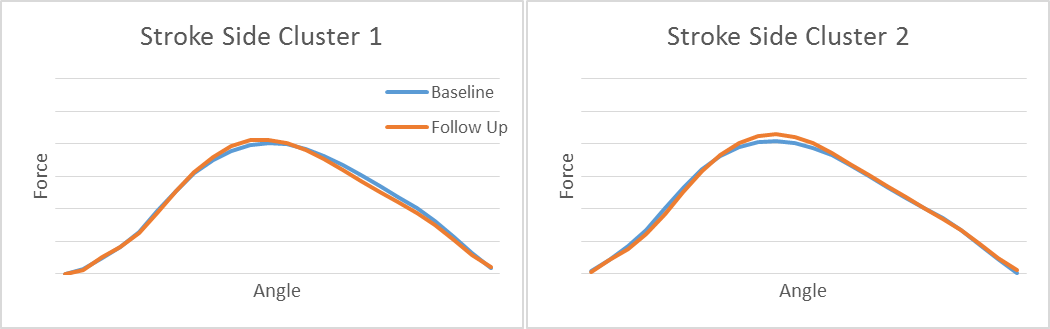
So, I'm quite happy that projecting the PCA results from a baseline to a follow up test is working quite well. This has allowed me to identify what an individual's best technique is, then track how that changes from one test to another.
Now for some questions that I've already raised with myself;
Why don't you just use the power outputs to group the high power strokes together rather than going through the extra process of identifying the shape and then going back to the power data? My answer (to myself) would be that I'm interested in the shape and the power, rather than the power itself. Just grouping by power might combine two disparate solutions that the athlete has generated to the problem of how to generate propulsive pin force, so I still want to separate out the different stroke shapes.
Why use the PCA from previous tests? Don't you lose information on the movement solutions that the athlete is generating based on their current physical condition? Well, yes, good point me. There's a good argument for generating PCA clusters both within and between sessions, though I think this would make the report quite confusing. Perhaps a hybrid solution to this would be to have a 'rolling' baseline, simply using the previous test as the baseline rather than a semi-arbitrary line in the sand from earlier in the season. That way as long as there's not too long between tests the physical condition should be fairly similar, so the solutions that the athlete generates should also be fairly similar.
There's other questions that have come up, but this post has already gone on for too long so it's probably time to finish it up here. I'd be really interested to hear other people's perspective so please get in touch if you're interested in discussing it further.
October 2018
Don't look for analytics to give you an answer, let it help you ask better questions to overcome bias.
Earlier in the year I wrote this piece about Tiger Woods, using him as an example to demonstrate that a broad statistical view of performance often provides a better picture than delving into the minutiae. There's a multitude of stats that can be calculated in golf that do break the scoring down into smaller and more specific elements of the game, but there's also broad stats like the average score to par for par 3, 4 and 5 holes that can often tell a better story than the very specific stats. That was my argument then, so how does that hold up after one of the most remarkable comeback years that you're likely to see, and can we use his statistical performance to learn more about combatting bias in analytics?
The general view amongst commentators this year was that Tiger's driving, and particularly driving accuracy, was holding him back. However, his iron shots were the part of the game where he was staying in contention and eventually leading him to a win. If you look to analytics to support that view he was ranked first in shots gained approaching the green (let's call that SGAG for the rest of this article) - a clear cut answer from analytics to support the theory. However, that shouldn't be how analytics is used.
If you think one piece of evidence supports your case, then instead of saying that's the answer and leaving it at that it should lead to another question. In this case, my question would be is the SGAG stat reflected in the scoring stats. He was 24th in par 5 scoring average, 5th in par 4 scoring average, and 110th in par 3 scoring average. So, that doesn't really make much sense. Shots off the tee on a par 3 are included in the SGAG calculation, so how is he so good in the SGAG ranking but so poor in the par 3 scoring average ranking? And while we're at it, why does the driving accuracy not seem to be hurting his par 4 scoring average at all and par 5 scoring average too much? There's a couple of confounding factors to be included here, including the fact that SGAG takes into account the difficulty of the course whereas scoring average doesn't. Even so, it shouldn't make that much of a difference.
What we likely have here is a combination of bias in the observations of how he is playing (particularly a confirmation bias, in that you see Tiger do one erratic drive and you use that to confirm your view that he does it all the time) and some loopholes in the stats themselves. The loophole in the SGAG stat is that it takes the average shots to complete the hole from a certain situation which is much higher when playing out of the rough than on the fairway (further explanation here). For the same distance from the hole, playing from the rough as opposed to the fairway increases the expected shots to finish the hole by 0.24 shots. If a player can be elite at manufacturing shots from the rough and putting themselves in a better position for the next shot, they will likely get a bigger return on their SGAG score. What's more, they can get that return without actually gaining a stroke on the field as being in a better position might just pull them back to an even chance of making par on that hole - if you're in a horrible position that you would be expected to drop a shot from then you can get a good SGAG score by just putting yourself in a position to make par. This makes more sense with Tiger when you see his Shots Gained off the tee ranking which is 104th, meaning he is often putting himself into a horrible position off the tee.
Analytics can be a great tool to cut through bias, demonstrating through the raw power of data that a clouded observation is untrue. However, just using analytics doesn't absolve you from incorporating bias into your analysis. The original question that you ask will likely be framed according to your own observational biases. The answer the results point to will be interpreted according to your own (likely biased) frame of reference. Where you stop asking more questions of the data will be based on your own (likely biased) assessment of the answer.
In my view, the best way to avoid these pitfalls is to not look for the data to give you answers, but to let it help you ask better questions with more open ended answers. This is particularly true given the errors involved in generating the statistics in the first place, as I discussed in this previous post on confidence intervals.
I stopped the case study of Tiger just as it was opening out some great questions - there's plenty more to be uncovered with him that his team can use to keep him competing for a long time to come. There's good information that can be gained from the minutiae, but there's no hiding from the broad view that the scoring stats provide. If he's to regularly compete, yes his driving needs to improve, but it's his par 3 performance where he can really start making some ground up on the field. Why that is the case and how can he do that, well, that's a good question…
September 2018
In sports analytics, numbers don't lie - but they rarely tell the truth without some prodding
There's a conversation in the movie version of Moneyball where Billy Beane is arguing with his chief scout, Grady Fusion. It's there to dramatize the tension between the old way of doing things and the new as opposed to something that actually happened, which of course it didn't. "Adapt or die" says Billy, followed by,
"You don't have a crystal ball. You can't look at a kid and predict his future any more than I can. I've sat at those kitchen tables with you and listened to you tell parents, "When I know, I know. And when it comes to your son, I know." And you don't. You don't."What made me think of this scene was an article on confidence intervals in baseball statistics. There is always going to be some uncertainty in stats, but as the interactive tool in the article on confidence intervals shows, it's wider than you think. This is the point that reminded me of that Moneyball scene. Although a player's performance can be quantified, are you confident that is a true reflection of a player's capabilities? Turn the dialogue in that scene against the statisticians - do you really know? Can you with supreme confidence say player x is better than player y - and if you can is this an actual revelation or is it something that any fan sitting in row z could see as well?
In the elite sport environment, analytics is definitely not the ultimate answer. Instead, it should be used to help you ask better questions. Working with data - from player tracking to technique analysis to performance statistics - reduces uncertainty, helps cut through bias and informs decisions. The noise inherent in all these data mean that there's no silver bullet, but there's enough rich information there for to lead the elite practitioner down the right path by helping them ask the right questions.
Having said all that, I don't know of any decent operator that treats performance data and statistics in a discrete and standalone way to answer any performance question. If you've paid any attention at conferences recently there's been presenter after presenter stressing that it's not about the collection or aggregation of data but about how the people you have available to you interpret that data and apply those insights. While it seems a fairly obvious point, I'm just as guilty of making it in a journal article from a couple of years ago - "People, not technology, should drive innovation in elite sport" (feel free to email me for the full article). I wanted to say in it something like innovation should be of the people, by the people and for the people, but I thought that was a bit corny for a journal (not too corny for this website though).
Numbers don't lie, but without some prodding they definitely don't tell you the whole truth either.
June 2018
The experience and pay problem in sport science - getting angry at the symptoms or treating the problem with our value proposition?
There's been a lot of chatter about unpaid internships in sport science, and rightfully so. But in my view we're just getting angry at the symptoms of a larger problem.
I'm no commerce expert, but I have been trying to run a sport science consultancy for the last decade. What I've learnt in that time is that sport science (and to a lesser extent strength and conditioning) has not properly determined its value to those holding the purse strings in sport.
When I see an unpaid or lowly paid job in sport, what I see is that the people paying for the position do not see any value in getting the best person for the position. This is partially a function of a problem in defining someone's value in this industry (i.e. quantifying personal performance of support staff) - it's much easier to reconcile the cost of an athlete with their on-field performance. But it also reflects the truth that if whomever is paying for the role saw a benefit and value to paying more (and therefore having a greater chance of securing the best candidate), they would find a way to make that work.
There is a disconnect in what we expect for remuneration and how our service is valued by management of high performance organisations (both pro and national). A high performance manager once remarked to me that sport scientists are pricing themselves out of jobs, and this was from a sport who was a very effective user of sport science and truly valued the contribution of their support staff. Again, this is a disconnect between the value we place on our own service and the value that is placed on it within high performance sport in general.
So, as an industry, what is our value proposition? There are a lot of business resources available that help to define it, but to me it comes down to the acknowledgement that good service providers make the organisation better, that you need to pay to get the best, and there is opportunity for elite organisations who get the best service providers to improve their organisation in a very cost effective way (much more cost effective than dipping into the transfer market). Getting the best candidate does make a difference, and if you don't pay you don't get the best. I don't think this is actually believed in the management of sporting organisations, particularly ones who are willing to bring in lowly paid (or unpaid) staff who are clearly treating service provision as a box ticking exercise.
In addition, we need to acknowledge that the value we place on our own services does not correspond with the value attributed to them by management, and it is up to everyone to push back on this to elevate the entire industry. But this can't be "I'm worth this because I just am". It must be grounded in the value that an elite service provider gives to an organisation.
March 2018
My Journey with GPS Athlete Tracking
While I was updating the look of the website I was hunting through some of the old programs and reports I'd generated to find some good ones to post. It made me have a think about a lot of the things I'd done in the past, where I wanted to take the analysis back then and whether any of it is still applicable now. It also prompted me to reflect on my journey with GPS devices.
My first role in applied sport science started at the South Australian Sports Institute at the end of 2001. This, from memory, also happened to be around about the time that GPSports was starting up, so we were happily taking out the little (big) yellow units out for a spin with whatever athletes we thought it should be used with. A lot of the stuff I was doing was around individual sports like rowing and sprint kayak. This was then augmented by the first iterations of what developed to become Catapult Sports, some fairly hefty boxes with an external antenna, loosely referred to in some circles as the 'little' rowing system (don't ask about the 'big' rowing system - problem child).
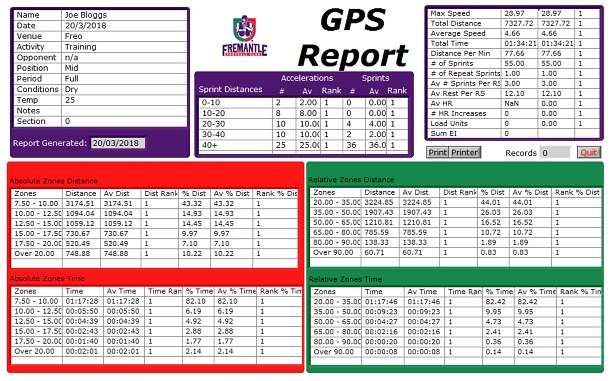
When Darren Burgess started at PAFC in 2005 he came in to SASI to see if there was a way to get more out of the GPS reports generated from the GPSports software. There was clearly a gap between the possibilities the data offered and what was being provided in the software as it was then, so we began working together to firstly improve the immediate service delivery but also to understand more about the units themselves and where the limits to what could reasonably be measured by them were. This is a truncated screen grab of one of the early reports - I recon this was around the third generation.
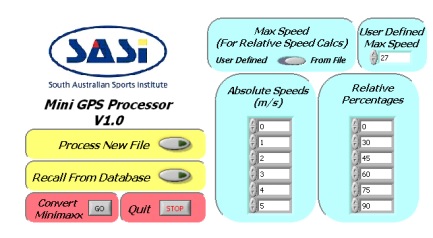
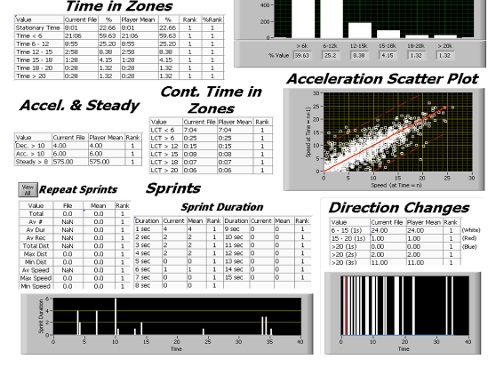
I can't remember when we switched to the early Catapult units, but this program had clearly been developed initially for GPSports and converted to accommodate Catapult as well (the convert minimaxx button tells me that). The data was processed with this executable program that I wrote, and a standard .mdb database was used to store the historical results which we could call up to generate the rankings seen next to the data. There's a couple of interesting elements to this report - the repeat sprints, sprint duration, direction changes, continuous time in zones, a lot of elements we were fishing with to see what would turn out to be important. The rankings weren't my idea but were a good one, particularly as we were learning about the system both from an individual and team point of view.
For me, the most important part was the acceleration scatter plot. This was plotting the current speed against the speed the athlete was going 1 second before, so essentially the 1hz GPS acceleration. You probably can see the solid red line, that's steady state. But there's also a faint red line that represented the cutoff for a significant acceleration (above the solid line) or a significant deceleration (below the red line). When you look at the plot, it's clear that a linear cutoff isn't appropriate for these data. Which led to this adjustment,
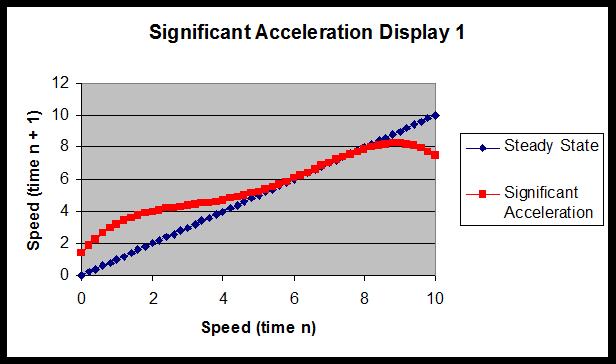
This is what I thought the significant acceleration line should look like when displayed as it was on the previous report. A better way to visualise it was like this, with starting speed on the x axis and change in speed on the y axis
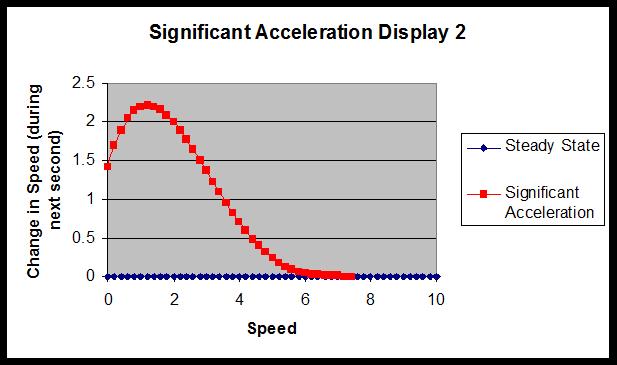
Unfortunately, we've not progressed past the static acceleration cutoff. I would love to see a rolling value used more frequently, and whenever people ask my opinion on acceleration I tell them that we should be trying to use a rolling rather than static cutoff, but it seems this is something that needs a bit more impetus to institute. It's good to see values that try to incorporate acceleration into the energy equation, like metabolic power, getting some attention. I've been helping Ted Polglaze from UWA do some nice research into this area. I'm not sure that metabolic power is the final answer, but it's a good step to a better understanding of how acceleration should be treated.
Once teams started embracing GPS, I began to branch out a bit more and provide some solutions for a few different groups, incorporating values that were important to each group along with the standard ones across the board. Here's a screenshot from one of the reports.
Don't pay any attention to the zones, I just stuck them in to make it go, and there's nothing in the database so all the averages are the same as today's values and all the ranks are #1. What you got from this report was today's results, the average for that player (for the specific activity) and the rank for that player against all the sessions in the database. This program was really just to bridge the gap between the units and the manufacturer's software, so when the manufacturer started providing some decent reporting capabilities in their software these programs became redundant, allowing me to move on to some more advanced analysis of GPS.
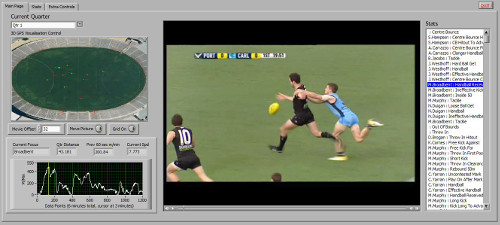
I was doing a lot of different reports for different groups, looking at things like integrating the GPS with statistics and video to help use GPS as a coaching tool,
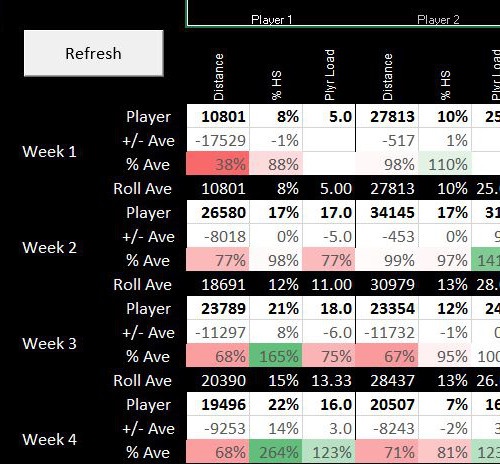
or adding specific dashboards and features that the manufacturer's software wasn't incorporating yet,
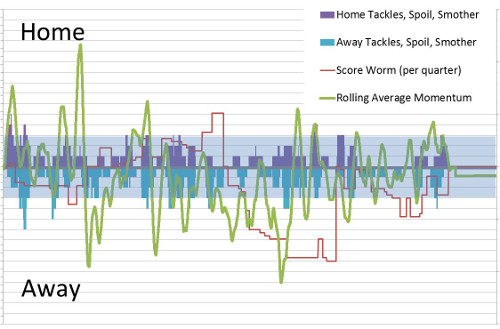
or incorporating GPS into other projects like looking into how to define momentum in a game via statsitics. This one I really liked, but it hasn't been picked up by any of the stats groups yet. Momentum to me is a funny concept because it's difficult to define but everyone knows when you can feel it during a game. What this method did was to define momentum via statistics which let you look at when you are scoring against the run of play, or with the run of play, or in neutral time, as well as looking at what the GPS results were like in that phase and whether there was any links between the two. It was really interesting to see which teams were able to score when the other team were dominating the statistics. The GPS numbers weren't showing much, but perhaps with a bit of mining there might be some diamonds unearthed.
One of the bespoke GPS projects I did around 2012 was for Jason Weber at Fremantle Football Club, he was wanting to look at the step by step accelerometer waveforms to see if there was any use in analysing them. I didn't think there was much in it, and I didn't think there would be enough 'clean' steps to get any good data from, but I gave it a go anyway. I was initially surprised by the number of quality steps, and the quality of the accelerometer data when you were able to isolate the 'clean' steps. The version that I got up and running for Freo was very hands on and time consuming, as I thought it probably needed to be that way to make sure you weren't including any rogue steps in the analysis. However, I revisited this project a few years later and started tinkering with the algorithms to automate the process, and it eventually became my PhD project when the original direction of my PhD ran out of steam. Hopefully I'll be able to share the PhD with everyone soon enough, but the methods behind it have morphed again into the toolkit that is up on another page of the website.
So, that's a quick retrospective of a long journey. If you've read this far, thanks for staying with me!
February 2018
Getting better outcomes and saving time
does Quality Assurance have a place in Pro Sporting Organisations?
It was fantastic to see the recent work by the Southwest Research Institute and San Antonio Spurs into the validity and reliability of the Catapult OptimEye S5 (find it here if you haven't already read it). It adds to the growing list of papers that take a good look at the quality of the information coming from technology that we regularly take for granted.
Their results suggest that we need to pay closer attention to the basics around calibration and validation of the units. But is this something we should be expecting of ourselves? Or is it the responsibility of the technology provider? It probably should be expanded to all of our technology, so should that be tasked to an independent body, or does it need to be done in-house? In this case, it's probably a combination of in-house calibration in partnership with a semi-independent body like a university or research institute with a link to the professional sporting organisation, but there's more to this question than this one situation.
For me, it also raises a bigger question into how quality assurance can be incorporated into the modern day sport science service in a professional sporting organisation. With the small number of staff as well as the short turnarounds between games and seasons, quality assurance normally gets missed out and in my experience is rarely addressed. I've definitely been guilty of this, but when I've been able to step back a little from the frenetic day to day operations it's clear that a better approach to QA would not only have led to a better and more professional operation but it also would have made that day to day servicing easier.
To my mind, the National Sport Science Quality Assurance Program the AIS has run has been a cornerstone of the success of sport science within the network of institutes around Australia. I can remember the discussions we had around a biomechanics NSSQA module that went around in circles without much resolution and looking back I'm disappointed that, although I was very new to the institute system at the time, I didn't understand the benefits that good QA processes would provide and I didn't devote enough time and energy to make the NSSQA process work.
I now can see that good QA will not only help with the quality, accuracy and confidence in the information provided, but amongst other benefits will help with succession planning (critical in this industry given the high turnover of staff), accessing and understanding historical data, identifying areas where professional development will help staff, and help semi-skilled staff like the expanding number of trainees brought into pro environments to deliver a competent service.
Perhaps most importantly, it will save the most critical commodity in a pro organisation - time.
For sure, it will cost time to get it up and running to begin with. But that doesn't necessarily mean that you need to take time out from the service you are already providing. There are people out there who can help set these systems up for you. I for one have quality assurance as a part of my health check service (kind of like an audit to help clubs make the most of the resources available to them).
The bottom line for professional sporting organisations is that QA is important, it is not expensive, it will save you time, and it will make you more elite.
February 2018
Never mind the bollocks
The fascinating case of using statistics to analyse Tiger Woods
We were born under a month apart, so for my entire adult life Tiger Woods has been a constant presence in the sporting world, and a constant source of fascination. For me, the fascination has been heightened by how he has tried to adapt his game to his body, who he has reached out to (including members of my own profession of biomechanics) and how that's helped or hindered his game. This year will clearly be no different, with the question of 'is he back?' being constantly asked and analysed.
For a veteran like Tiger, the mountain of statistics available in golf (freely available from the PGA tour website) lets you dive deep into historical data, looking for trends and breakpoints like points where injuries have occurred or his equipment has changed. You can very easily get lost mining away at the data, looking with increasing precision into elements of his game.
This is a feature of a lot of modern sports analytics, and I think it's mostly a waste of time. I've done this sort of work with a lot of different sports at the truly elite level, and the interconnections between the different stats render them to be more a source of idle interest rather than something that can be used to truly effect and measure performance in an applied setting.
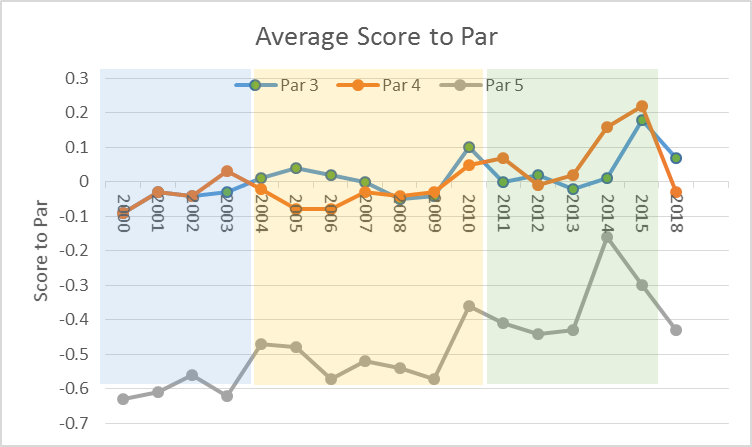
So, cutting through all the bollocks, here's the graph of what I see as the important bit.
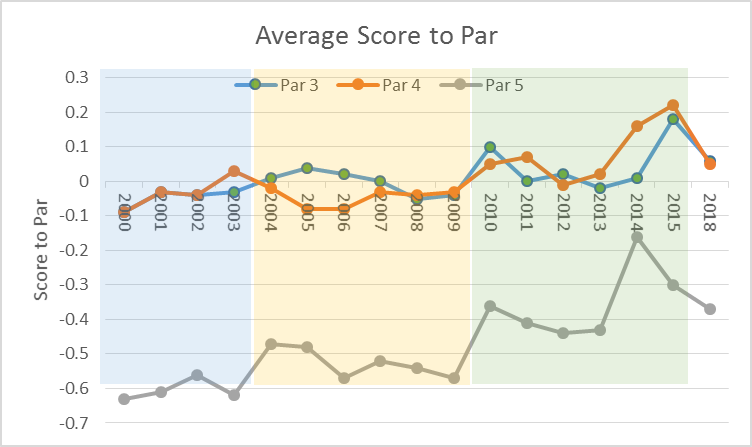
In his heyday, his scoring was clearly driven by his average score to par on par 5s. There were years where he was really struggling for results and his par 3 and par 4 performance reflected those, but there were also years like 2012 (3 wins) and 2013 (5 wins) where he had success (including 3 top 10s at majors) where his par 4 performance was close to his average. This really just confirms the general commentariat view, that his success will be driven (pardon the pun) by his performance with longer clubs off the tee, but what it also does is provide a concrete focus that takes into account all the interplay of distance and accuracy and course management. You have a very specific yet still general set of standards to measure yourself by, and all the interventions you put in place can be brought back to and evaluated by these statistics.
The take home message from this is that there is always the temptation to delve deeper, and that temptation doesn't need to be avoided. But before going deeper with the next step, the best thing to do would be to go back to the broader view to make sure that going deeper is actually going to do something other than satisfy a curiosity.
So, how is this year shaping up? After two tournaments, the par 5 performance is ok, the par 4 and par 3 performance needs some work, which would suggest it's to do with the approach to and work around the green, an area that he has traditionally been quite stable in (given the long term par 3 performance). What I would expect to see as the season progresses and the rust is shaken off is that the work in to and around the green will improve with more competitions, and we could very well see the 2012/13 Tiger back again very soon. Are we going to see the 2007/08/09 Tiger back? Perhaps, but when you do delve a little deeper his driver club head speed so far is around 5mph down on those years so you'd expect his par 5 performance wouldn't improve enough to get to that level.
Still, fascinating to watch it all unfold.
November, 2017
Biomechanics and Performance Analysis
what capture and analysis will look like in 2024 but the best will be doing now
I was recently asked to do a presentation at a Dartfish expo day - the day ended up being rescheduled and clashing with a trip to the UK so I wasn't able to do the presentation, but the process of getting the presentation ready was a really useful opportunity to reflect on a few aspects of where biomechanics and performance analysis is now and where it is likely to go in the future.
The talk itself ended up being very similar to a previous post, but I thought I'd share it here anyway. Plus, any excuse to use this youtube clip again;
I love this footage, and it's also a great way to look back at the setup required for high speed video and in-the-field analysis of technique in the late 70's. The high speed camera setup that the Biomechanics department at UWA set up here was complicated, required experts to set up and run, and took a long time to review the results. If we move to the present day, we can now get 1000 frames per second on a smartphone. Sony has been including 200 fps in their handicams since around 2005 (ish), and have really been leading the way in terms of pushing high speed capability into more consumer friendly models. Everyone has at least seen the high speed capability of iphone 6 and up, this is 240fps, and this has been beaten by the Sony Xperia XZ premium which provides 1000fps.
So where is this going in the future? Well it's just going to get easier to get great footage. Sony has also released the action cam package, which allows multiple camera setups that can give synchronised capture at 200fps, controlled from a portable unit that can be worn as a watch (that also allows for remote review of the video that's just been captured). There's also powered tripod mounts that can follow a player, giving isolated vision automatically.
Complicated setups that required specialist staff will steadily become a thing of the past. Consequently, teamwork within the capture stage will become even more important than now. Performance analysis staff will likely move to co-ordinating a semi-automated capture (or just using broadcast footage which is becoming more and more accessible) rather than doing the capture themselves, which means they need to work collaboratively rather than independently to get the footage that is needed. Freeing them up from just standing behind the camera should also leave plenty of time for another aspect - data capture of wearable monitors and 'smart' sporting equipment.
Sony has also released the smart tennis sensor - this is a monitor that sits on the end of the racquet handle and gives some really detailed metrics on performance. In the past this would be something that required extremely specialised staff (possibly from bespoke equipment and applications, which would almost certainly be prohibitively expensive). Now it's something that the athlete can do themselves, from installation of the sensor to capture to download. I haven't taken a close look at this sensor and don't know about how accurate it is and which metrics can be relied on (they may all be fine, but there might also be some dodgy ones as well), but it is at least an indicator of where the future lies.
A sensor I have done some testing with is the blast baseball sensor. Like the Sony tennis sensor it sits at the end of the bat and provides metrics on bat movement. There's also 'smart' soccer balls from Adidas, wearable sensors for basketball shooting, and of course the explosion in GPS systems.
There's also metrics on the outcome of the movement. The trackman system has been used for many years now, using radar tracking to follow the path of the ball not just in golf, but baseball, tennis, and also athletics in the hammer and shot put. These metrics are really, really important as they provide some real numbers on actual performance rather than inferred performance from technique - where you need to compare the athlete's technique to an ideal technique that is often not properly matched to the physical constraints on that athlete
Technique itself is also becoming easier to quantify. Systems like the k-vest are becoming user friendly enough for coaches to use themselves without the need for specialist biomechanics staff for the setup and operation. So overall the future of the capture element will become more automated, easier to set up and require less specialist staff. However, all this means is that the staff that in the past would have had to be hands on in the capture stage can perhaps be more hands off, co-ordinating the capture and helping everyone form athlete to coach to support staff to work as a team in getting the vision and data needed for the next stage, analysis.
The analysis stage is where quality staff and, perhaps more importantly, structure and teamwork within a team of service providers can really provide a competitive advantage. Elite support staff - smart, technically sound, experienced professionals, can take the raw data coming in from all these disparate sources and turn it into information that the coach and athlete can use to make good, informed decisions.
Here's one example of where the future could be headed. The blast baseball sensor I talked about earlier is a great example of the new breed of smart sensors, in that it can be installed and used in just about any situation, small enough to be used in normal training or competition (so the validity of the numbers is really high), the athlete can do the installation and capture themselves, video can be captured on a smartphone, and the application can automatically link the data and the video. So, on the surface it's an all in one solution. However, there are limitations and with a little extra information the results could be so much better. The first area where using the sensor just by itself falls down is that it's not an outcome based measure, and the interaction between metrics like bat speed, power, 'blast' factor and attack angle don't necessarily have global ideal values to use as a model, let alone an model that is individualised to an athlete's own physical strengths and constraints. What you really need is to pair it with an outcome based measure, like trackman, to identify what is a good number and a bad number for an individual. The outcome measure could also be as simple as categorising good and bad contact (as in subjective coach or athlete evaluations), but if you can add in some more advanced metrics like those that are available from trackman (if you have $30,000 to spare) or rapsodo (if you have $3000 to spare) then you can do some really nice data analysis to get more from the data.
How we have done this is to use a cluster analysis (a form of analysis that groups repetitions together in clusters of similar repetitions) to identify the metrics that occur when you have good and bad contact, so you can end up with an individualised performance model for each athlete. We've also done the cluster analysis just on the blast data rather than the outcome data, and this way we're able to identify the swings with high and low values in different metrics.
There is very rarely such a thing as a representative trial, one where the video from one repetition can be carbon copied to all similar outcomes. There will be elements of the action which vary from one trial to another that are important, and others that are irrelevant. There will also be actions that are important for one individual and irrelevant for another. Without context, analysis is fraught with danger (and there is massive potential for personal bias to colour the analysis). You should be trying to find ways to cut through any bias that the coach or athlete has when they are analysing the action, allowing interplay between the information available to help make good decisions and provide good feedback.
In the case of the system described here for baseball, we've also added in a k-vest to give us some kinematic metrics. This is making the system into something that can give a complete picture of what has happened, which can then be fed into some sort of advanced statistical analysis program (in our case the cluster analysis) to identify the movements that are causes and the movements that are effects, as well as the movements that are important and the movements that are irrelevant. Now you can adjust the feedback to suit the athlete, facilitating the feedback and growing understanding in the athlete.
I believe this sort of system is how the future of this sort of analysis is going to look. The elements are;
1. Video
2. Movement data (ie. kinematic data from the k-vest)
3. Smart sensor data
4. Outcome data (from systems like the trackman)
5. Advanced statistical analysis (in our case the cluster analysis) to identify key elements of the action that lead to the good or bad outcome
6. Something and someone to bring everything together for feedback, making all the elements work as a team to give good information that leads to good decisions.
So in a modern coaching world, where capture is easier and analysis needs to step up to the next level, you need expert support staff and a platform where all the disparate elements (both in human and data terms) can be brought together to work as a team to provide the right answers.
February, 2017
Why should you use a biomechanist?
I once had a chance meeting with Aussie racing driver Mark Webber - one of the nicest, most generous and fiercely proud Australians there is. In that brief chat I had the chance to pitch a scenario where a group I was consulting to at the time could get some help from his current team, Red Bull Racing. To his great credit, given he probably gets hundreds of these proposals each year, he listened and suggested I follow up through a mutual friend. In the end we were able to make something happen - not a grand partnership but something really positive that definitely shaped the organisation I was consulting to over the next few years.
For me, this was a brilliant example that applies to a lot of situations in the elite environment. Time was limited, the concept was a little abstract, but the message needed to be delivered then and there. The proposal needed to be broad but have a very simple and targeted result - making the organisation I worked with and he cared about better, helping them win. The detail about how and when could come later.
The lessons learnt from this experience can maybe be used to solve another issue I've been thinking about recently. I put a call out over social media last week to get an idea of how many biomechanists there are working in elite sport who aren't also employed at an institute or university. The answer is… not many - me and only a couple of others.
I think this is a problem. The world of an academic sport scientist is very different from the world of an applied one, and there's precious few people I know that can effortlessly switch their mode of operation between the two. Where an institute based biomechanist is used, there are often issues with continuity of service, with testing tending towards a 'one and done' approach that often leads to a club being disappointed that a complex problem can't be fixed with a wave of a magic wand (albeit a magic calibration wand).
There's many barriers to getting more biomechanists into elite sporting organisations. Some are real issues but others are just the result of misguided perceptions. So, why should an elite sporting organisation to engage a biomechanist? Using my lessons learnt from past experiences, here are my reasons why.
A biomechanist in your organisation will help you win because everyone in your organisation will be better at what they do.
You will have better coaches, because they will be able to use data and advanced analysis to augment their own intuition - they won't have to guess where the root cause of a technique fault lies.
You will have better analysts, because combining video analysis with big data is what biomechanists are trained to do - they will be able to find new insights into technical and tactical performance.
You will have better scientists, because wearable sensors and other monitoring tools like force plates are our bread and butter - they will get more out of the technology you already have.
You will have better medical and rehabilitation staff, because analysing movement is what we do best.
Finally, it's not expensive - technology is cheap and when the field, the pitch or the court is your lab then any analysis is possible.